
There’s reason for optimism that new rules changes will revitalize batters’ relevance after 2021’s foreign substance ban made no lasting difference
Year-by-year share of total Box-Toppers points earned by batters, 1995-2022
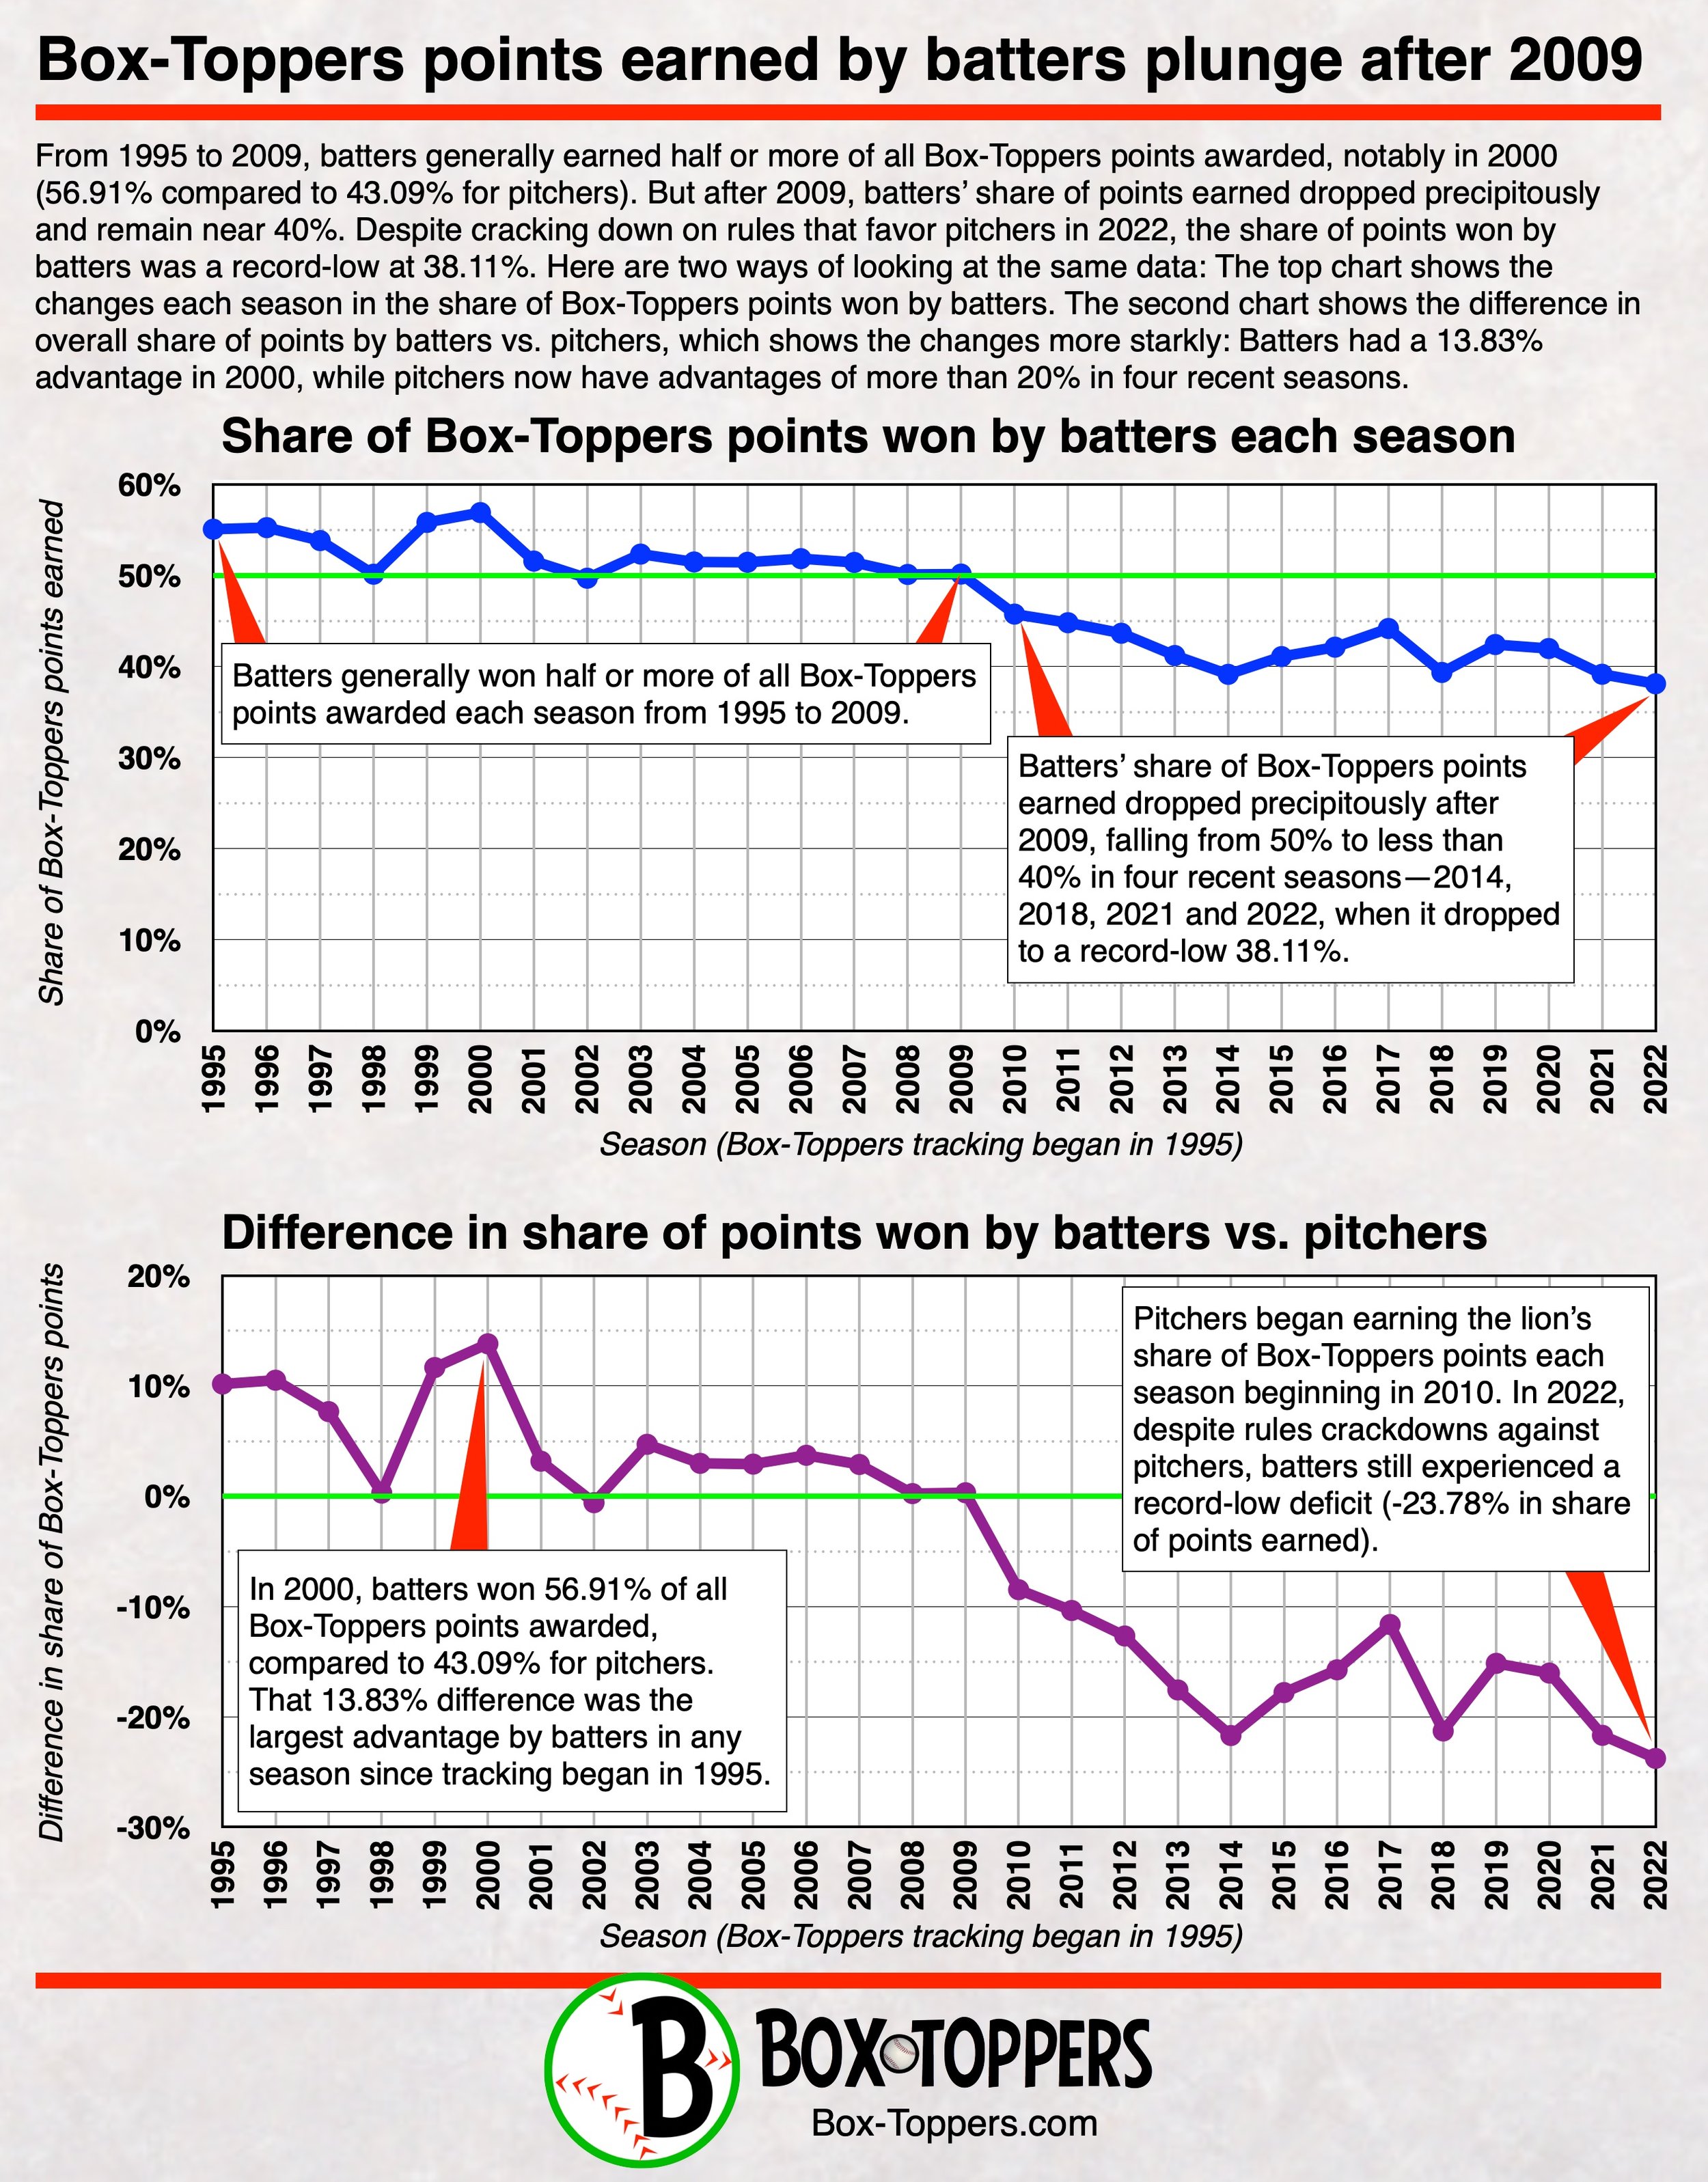
From 1995 to 2009, batters consistently earned 50 percent or more of all Box-Toppers points awarded each season. But in 2010, batters share of all points earned dropped precipitiously and has never recovered. Since 2011, the share earned by batters has been below 45 percent, including four seasons below 40 percent—2014, 2018, 2021 and the most recent season, 2022.In 2022, batters earned 38.11 percent of all points awarded—1,102.0 of 2,891.8. That broke the all-time record-low set in 2014, when batters won 39.14 percent of all points awarded. And this happened despite more strigent rule-enforcement during the entire season intended to make pitchers less dominant.
Here is a look at the share of total Box-Toppers points earned by batters each season, since 1995, when Box-Toppers tracking began. The remaining share of points was won by pitchers each season. The “Difference” column shows the percentage point difference in the share of points between batters and pitchers each season, ranging from the largest lead by batters (+13.83% in 2000) to the largest deficit by batters (-23.78% in 2022). Numbers in red indicate batters won fewer than 40 percent of Box-Toppers points, blue indicates batters won between 40 and 50 percent and green indicates batters won more than half of all points awarded.
| Year | Batters BTP % | Difference |
|---|---|---|
| 1995 | 55.09% | +10.17% |
| 1996 | 55.26% | +10.52% |
| 1997 | 53.84% | +7.67% |
| 1998 | 50.14% | +0.29% |
| 1999 | 55.84% | +11.67% |
| 2000 | 56.91% | +13.83% |
| 2001 | 51.59% | +3.18% |
| 2002 | 49.71% | -0.59% |
| 2003 | 52.35% | +4.71% |
| 2004 | 51.49% | +2.98% |
| 2005 | 51.45% | +2.91% |
| 2006 | 51.86% | +3.71% |
| 2007 | 51.44% | +2.88% |
| 2008 | 50.12% | +0.24% |
| 2009 | 50.16% | +0.31% |
| 2010 | 45.76% | -8.48% |
| 2011 | 44.82% | -10.37% |
| 2012 | 43.66% | -12.68% |
| 2013 | 41.21% | -17.58% |
| 2014 | 39.14% | -21.71% |
| 2015 | 41.09% | -17.81% |
| 2016 | 42.13% | -15.75% |
| 2017 | 44.18% | -11.64% |
| 2018 | 39.35% | -21.30% |
| 2019 | 42.42% | -15.16% |
| 2020 | 41.98% | -16.04% |
| 2021 | 39.15% | -21.69% |
| 2022 | 38.11% | -23.78% |
Will baseball’s 2023 rules changes finally place a check on pitchers’ decade-plus dominance over batters?
Or will the changes prove as ineffectual as the 2021 crackdown on pitchers using sticky, foreign substances on baseballs? After stricter enforcement of those rules went into effect in June 2021, batters briefly and temporarily gained ground, but subsequently in the 2022 season, when umpires were seen enforcing the rules in every game, pitchers had their most dominant season over batters ever, as measured by Box-Toppers.
There is some reason for optimism that the new rules changes for 2023 will restore some balance to the game that was evident from 1995 to 2009, when batters generally won 50 percent or more of all Box-Toppers points awarded. But batters’ share of Box-Toppers points dropped precipitously after 2009 and has fallen to below 40 percent in four recent seasons, including 2022, when batters earned a record-low of 38.11 percent of all points. (At the top of this page is the graphic Box-Toppers points earned by batters plunged after 2009, with the accompanying chart with specific numbers detailing the decline.)
Since 1995, Box-Toppers has tracked who most helps their team win the most games. Using standard box score statistics, Box-Toppers uses a simple formula to determine a Player of the Game for each Major League Baseball game played. That player is the person who contributed most to his team’s win. In regular season games, players earn 1.0 Box-Toppers point for being named Player of the Game and can earn bonus points for being Player of the Day or top player or batter in their league for the day.
A look at 2023 rules changes
There are three main rules changes for 2023:
Pitch timer
Among the requirements of this rule change, designed to speed the pace of play:
There will be a 30-second timer between batters.
With bases empty, pitchers are required to begin their motion 15 seconds after receiving the ball.
With runners on, pitchers are required to begin their motion 20 seconds after receiving the ball.
Pitchers are limited to two disengagements on the mound per plate appearance with a runner on first base. Those disengagements, for pickoff attempts or step-offs, reset the pitch clock. If a pitcher steps off for a third time and no out is recorded, it is treated as a balk and any runners move forward one base.
Batters must be in the batters box and alert to the pitcher with 8 or more seconds remaining on the pitch clock. A batter has one time-out per plate appearance.
If pitchers don’t begin their motion in time, they will be charged with an automatic ball. If batters are not set in time, they are charged with an automatic strike.
Shift restrictions
All four infielders must begin each pitch on the infield dirt with two infielders on either side of second base. The radical shifts of recent years, for example, with three infielders placed between first and second base and one or two them playing in the outfield grass, helped produce a lot of groundouts. The hope now is those balls will be in play, resulting in either base hits or more impressive-looking defensive plays.
Bigger bases
First, second and third bases have been expanded from 15-inch square bags to 18-inch square bags. Mostly done for player safety, the bigger bases marginally decrease the distance between bases, helping runners steal bases or beat out more throws.
Shift restriction rule most likely to help batters
Of the rules changes most likely to help batters regain a larger share of Box-Toppers points is the shift restriction rule. In fact, the precipitous drop of batters’ share of Box-Toppers points earned almost exactly corresponds to the increase in the use of the defensive shift, first popularized by then-Rays manager Joe Maddon in the late 2000s. By 2015, the shift was employed during 10 percent of all pitches and by 2021, it was employed during 31 percent of all pitches, according to Baseball Savant statistics cited for a 2022 Sports Illustrated article.
The other rules changes could also aid batters. More stolen bases could result from the pitcher step-off restriction, which could result in more runs. The pitch-timer rule may result in pitchers being unable to recharge to bring maximum effort to every pitch, reducing strikeouts and taxing pitchers more quickly, reducing the number of innings they are able to pitch.
Larger bases may also aid batters to reach safely more often, steal more bases and score more runs, which would result in higher Box-Toppers game scores, but that change seems so marginal that it’s hard to believe it’s going to make a big difference.
While rules changes could restore balance and make batters more relevant in the game, the 2021 rules change to limit pitchers’ use of sticky substances was also seen as an aid to batters. Yet pitchers quickly adapted to the new rule and rather than reduce the dominance of pitchers, the end result was that pitchers were more dominant, as measured by Box-Toppers.
And one other thing to consider: One reason batters Box-Toppers point totals were generally higher from 1995 to 2009 was the advantage they might have gained by using now-banned performance enhancing drugs like steroids. Testing and punishment for PEDs began in 2005 and were revised and strengthened in subsequent years. While pitchers and batters were both suspected of using PEDs, it may have been that batters generally gained a larger edge from using them and later lost that edge when their use was prohibited, possibly resulting in the precipitous drop in batters’ Box-Toppers point totals after 2009.
Rules changes come as batters rendered more irrelevant
Baseball imposes these rules in 2023 after reaching a crisis that has not only endured but worsened over the past dozen years. It has gotten to the point in Major League Baseball in which batters were being pushed increasingly to irrelevance, less important to the outcome of the game.
From 1995 to 2012, batters collectively averaged 31,758 strikeouts per season. But in the five full seasons between 2017 and 2022, batters averaged 41,410 strikeouts per season, a 30 percent increase from that earlier period. As strikeouts rose, so did home run numbers as players swung hard for the fences. But at the same time, overall batting averages dropped.
In 2022, only four batters earned 10.0 or more Box-Toppers points during the season, breaking the all-time low of five players doing so in a regular-length season (2014, 2018 and 2021). By contrast there were 20 or more batters with 10.0 or more Box-Toppers points each season from 1995 to 2006, except for 2003, when there were 16.
And with the decline in Box-Toppers points earned by batters, far fewer batters reach 15.0 or more Box-Toppers points in a single season. From 2000 to 2009, there were 35 times a batter reached 15.0 Box-Toppers points in a season. But from 2010 to now, there have only been seven times a batter achieved a 15.0-point season, the last in 2017 by Anthony Rizzo of the Cubs (15.5). In 2022, Pete Alonso of the Mets came close with 14.9 points.
Since 1995, there have been eight seasons in which no batter has reached 15.0 Box-Toppers points (and that excludes the pandemic-shortened 2020 season). One instance was in 2005. The remaining seven have happened in 2012 or later, including six in the past seven full seasons—2015, 2016, 2018, 2019, 2021 and 2022. (Story continues below graphic.)
Sticky substance rule of 2021 didn’t help batters
Week-by-week 2022 Player of the Game winners, pitchers vs. batters
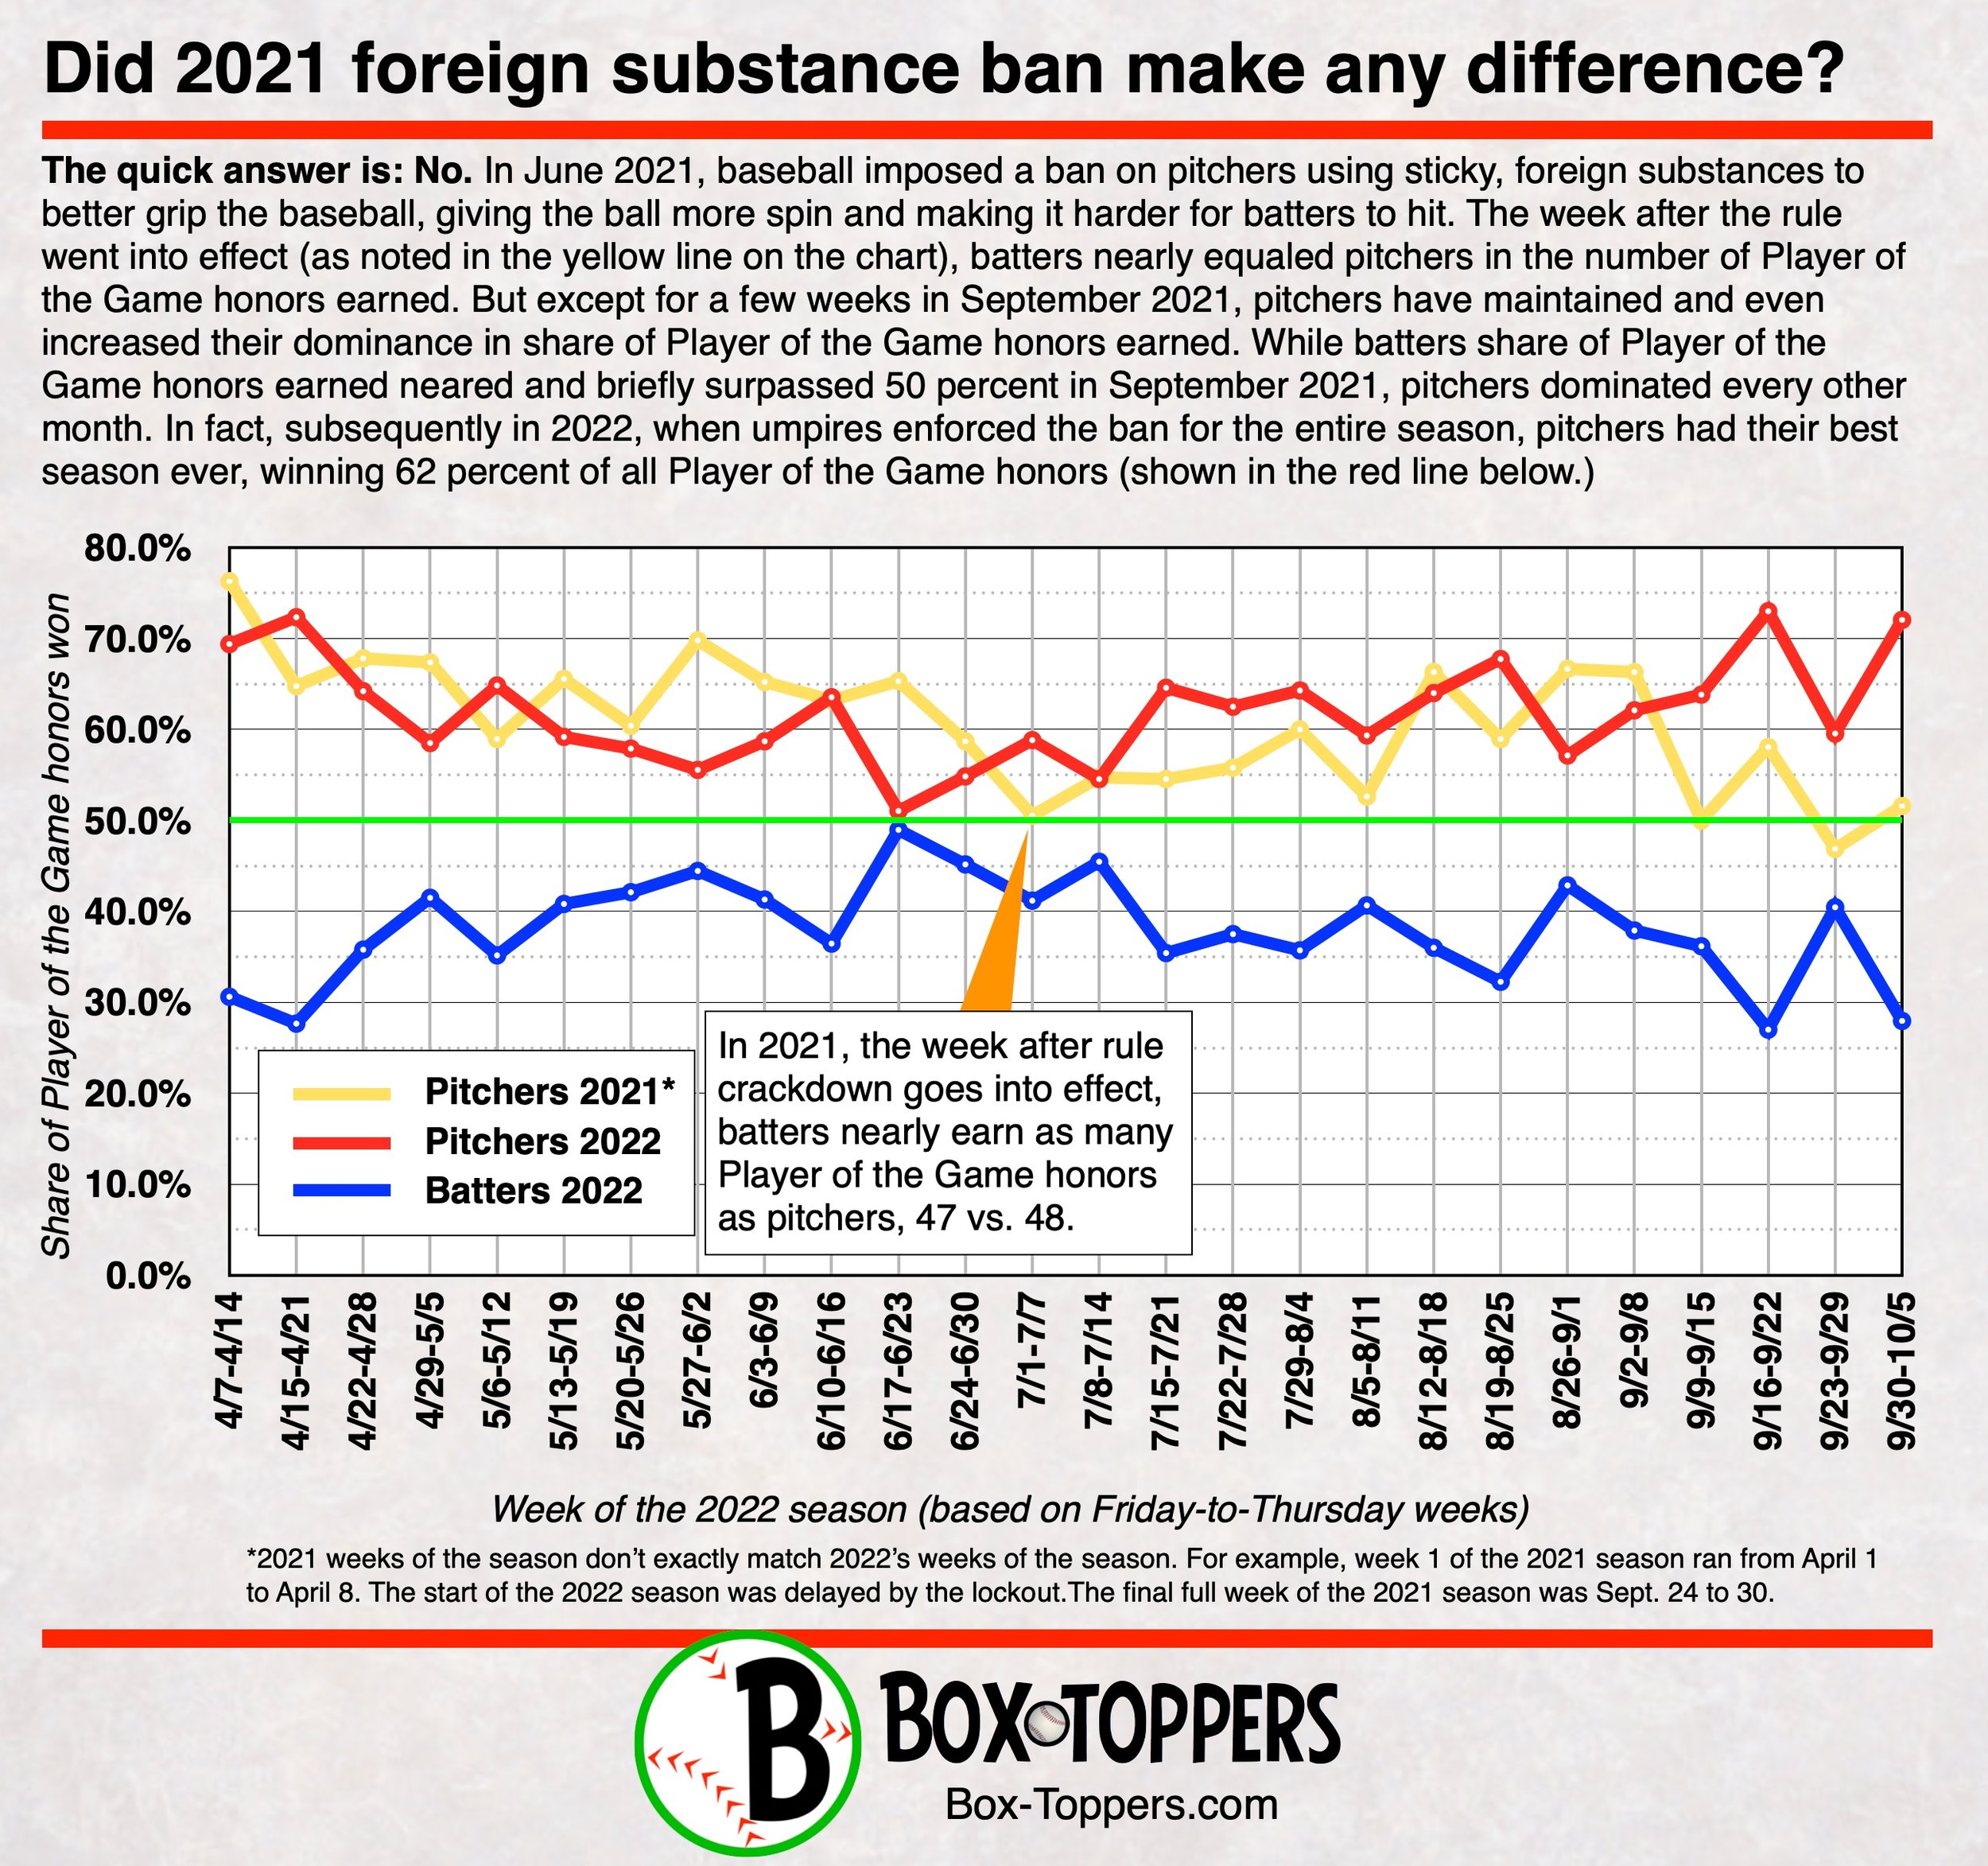
Despite rules changes designed to help batters, pitchers had their best season ever in 2022, winning Box-Toppers Player of the Game honors in 62 percent of all games played, compared to 38 percent for batters.Here is a week-by-week look at how often pitchers and batters won Box-Toppers Player of the Game honors in 2022. First column is the week (based on a Friday-to-Thursday week), next is the number of games played in that week, followed by the number of pitchers who won Player of the Game honors that week, the percentage of pitchers winning Player of the Game honors, the number of batters winning Player of the Game honors and the percentage of batters winning Player of the Game honors. Numbers shaded in red indicate pitchers won 60 percent or more of Player of the Game honors in that week. Numbers shaded in blue indicate pitchers won between 50 and 60 percent of all Player of the Game honors in that week. There was no week in 2022 in which batters won more than 50 percent of Player of the Game honors—the closest was June 17 to 23, when batters won 49 percent of all Player of the Game honors.
| Week | Games | Pitchers | Pct. | Batters | Pct. |
|---|---|---|---|---|---|
| 4/7-4/14 | 98 | 68 | 69.4% | 30 | 30.6% |
| 4/15-4/21 | 94 | 68 | 72.3% | 26 | 27.7% |
| 4/22-4/28 | 95 | 61 | 64.2% | 34 | 35.8% |
| 4/29-5/5 | 94 | 55 | 58.5% | 39 | 41.5% |
| 5/6-5/12 | 91 | 59 | 64.8% | 32 | 35.2% |
| 5/13-5/19 | 98 | 58 | 59.2% | 40 | 40.8% |
| 5/20-5/26 | 95 | 55 | 57.9% | 40 | 42.1% |
| 5/27-6/2 | 99 | 55 | 55.6% | 44 | 44.4% |
| 6/3-6/9 | 92 | 54 | 58.7% | 38 | 41.3% |
| 6/10‑6/16 | 96 | 61 | 63.5% | 35 | 36.5% |
| 6/17-6/23 | 96 | 49 | 51.0% | 47 | 49.0% |
| 6/24-6/30 | 93 | 51 | 54.8% | 42 | 45.2% |
| 7/1-7/7 | 102 | 60 | 58.8% | 42 | 41.2% |
| 7/8-7/14 | 99 | 54 | 54.5% | 45 | 45.5% |
| 7/15-7/21 | 48 | 31 | 64.6% | 17 | 35.4% |
| 7/22-7/28 | 96 | 60 | 62.5% | 36 | 37.5% |
| 7/29-8/4 | 98 | 63 | 64.3% | 35 | 35.7% |
| 8/5-8/11 | 91 | 54 | 59.3% | 37 | 40.7% |
| 8/12-8/18 | 100 | 64 | 64.0% | 36 | 36.0% |
| 8/19-8/25 | 93 | 63 | 67.7% | 30 | 32.3% |
| 8/26-9/1 | 91 | 52 | 57.1% | 39 | 42.9% |
| 9/2-9/8 | 95 | 59 | 62.1% | 36 | 37.9% |
| 9/9-9/15 | 94 | 60 | 63.8% | 34 | 36.2% |
| 9/16-9/22 | 100 | 73 | 73.0% | 27 | 27.0% |
| 9/23-9/29 | 89 | 53 | 59.6% | 36 | 40.4% |
| 9/30-10/5 | 93 | 67 | 72.0% | 26 | 28.0% |
| Totals | 2430 | 1507 | 62.0% | 923 | 38.0% |
Major League Baseball made an attempt to reduce the dominance of pitchers after the start of the 2021 season. In the early part of that season, pitchers were holding batters to record-low batting averages, strikeouts were at an all-time high and balls were being put in play less than ever. Pitchers threw six no-hitters in the first two months of the season, threatening to shatter the record for most no-hitters in a season—eight in 1884 and the “modern” record–seven in 1990, 1991, 2012 and 2015. (Eventually, nine no-hitters were recorded in 2021, setting a new record.)
But in June 2021, Major League Baseball began a rules crackdown on pitchers, having umpires routinely check their gloves, belts and hats for illegal sticky, foreign substances. These substances, such as sunscreen, pine tar or the commercially available Spider Tack, allow pitchers to better grip the ball and improve the ball’s spin rate, creating pitches with more movement and speed that are harder to hit.
And the rules crackdown did seem to work:
Prior to June 21, batters won just 34.5 percent of all Box-Toppers Player of the Game honors (368 of 1,067 games played).
On June 21 and after, batters won 43.5 percent of all Box-Toppers Player of the Game honors (592 of 1,362 games played).
Of course, this still meant that even after June 21, pitchers were still winning the vast majority of Box-Toppers Player of the Game honors. But the rate of their dominance decreased from 65.5 percent prior to the June 21 rules crackdown and 56.5 percent after.
And while batters did gain from the rules crackdown, pitchers came within a whisker of setting a new record in 2021 for highest share of Box-Toppers points earned in a single season compared to batters. Pitchers earned 1,757.5 of the 2,888.4 Box-Toppers points awarded in 2021 (60.85 percent), compared to batters earning 1,130.9 (39.15 percent). That fell just short of the record of 60.86 percent of points won by pitchers in 2014.
But with the sticky-substance rule change in full effect throughout the 2022 season, pitchers had their best season ever as measured by Box-Toppers, since tracking began in 1995. Umpires were seen enforcing rule during the entire season, yet pitchers still dominated. Did pitchers adapt to the new rule or were the umpire checks so superficial they resulted in a sort of security theater of going through the motions and seeming to check?
No matter the result, the rules change proved completely ineffectual as measured by Box-Toppers since batters gained no advantage and actually lost ground compared to pitchers.
In fact, looking at the graphic elsewhere on this page, Did 2021 foreign substance ban make any difference? and the accompanying statistical chart showing pitchers share of Box-Toppers points earned by week, the sticky substance ban may have had only minimal effect, even in 2021 when it was first enforced. Instead, the time of the season may have had a much greater influence on whether pitchers or batters won Player of the Game honors.
As seen in the graphic, the trendlines for pitchers winning Player of the Game honors was largely similar in both 2021 and 2022:
Pitchers began the season both years winning 70 percent or more of Player of the Game honors.
Generally batters gradually gained ground through April and May when in June, they finally nearly won as many Player of the Game honors as pitchers. In 2021, batters won 49 percent in the final week of June, which happened to be the week after the sticky substance crackdown went into effect. But is it possible that was simply coincident to the time of year when weather warms and batters naturally find their groove and begin performing better in relation to pitchers? That’s because in 2022, batters gained ground and also nearly won almost half of all Player of the Game honors at about the same time in June that year, too. The sticky substance ban had been in effect through all of 2022 but generally, batters to that point in the season were mirroring their 2021 share of Player of the Game honors when no sticky substance rules were in effect.
In fact, as both seasons progressed, pitchers gained ground in similar fashion week-by-week through July and August, winning a larger share of Player of the Game honors, both years generally between 55 and 70 percent each week in both 2021 and 2022.
The trendlines depart in September. In 2021, batters share of Player of the Game honors neared or surpassed 50 percent in three of the four weeks, a possible indication the sticky substance crackdown was having an effect. But in September 2022, by contrast, pitchers only increased their dominance, winning between 60 and 75 percent of all Player of the Game honors each week.
In all, while the sticky substance ban may have achieved some goal of Major League Baseball—reducing velocity, spin or just adhering to a stricter rules standard—it did nothing to reduce pitchers’ dominance winning Box-Toppers Player of the Game honors. As mentioned, pitchers overall in 2022 had their best season since Box-Toppers tracking began in 1995, winning 62 percent of all Box-Toppers Player of the Game honors (compared to 38 percent for batters) and 61.89 percent of all 2022 Box-Toppers points (compared to 38.11 percent for batters).
(Note that because of Box-Toppers bonus points there is a slight difference between share of Player of the Game honors earned and share of Box-Toppers points earned.)
Can these new rules for 2023 restore balance to the game, bringing batters back to higher batting averages, higher Box-Toppers point totals and perhaps even improving their overall share of Box-Toppers points won from below 40 percent to 45 or even 50 percent, where it has not been since 2009?